Uncertainties Example
[1]:
from IPython.display import display, HTML
display(HTML('<a target="_blank" href="https://colab.research.google.com/github/WaterFutures/EPyT-Flow/blob/main/docs/examples/uncertainties.ipynb"><img src="https://colab.research.google.com/assets/colab-badge.svg" alt="Open In Colab"/></a>'))
This example demonstrates how apply uncertainties to model parameters such as demand patterns.
[2]:
%pip install epyt-flow --quiet
Note: you may need to restart the kernel to use updated packages.
[3]:
import numpy as np
from epyt_flow.data.networks import load_ltown
from epyt_flow.simulation import ScenarioSimulator, ModelUncertainty, \
    RelativeUniformUncertainty
from epyt_flow.utils import to_seconds, plot_timeseries_data
Load the L-Town network with realistic demands:
[4]:
network_config = load_ltown(include_default_sensor_placement=True,
                            use_realistic_demands=True, verbose=False)
Create a new simulation:
[5]:
sim = ScenarioSimulator(scenario_config=network_config)
Set simulation duration to two hours:
[6]:
sim.set_general_parameters(simulation_duration=to_seconds(hours=2))
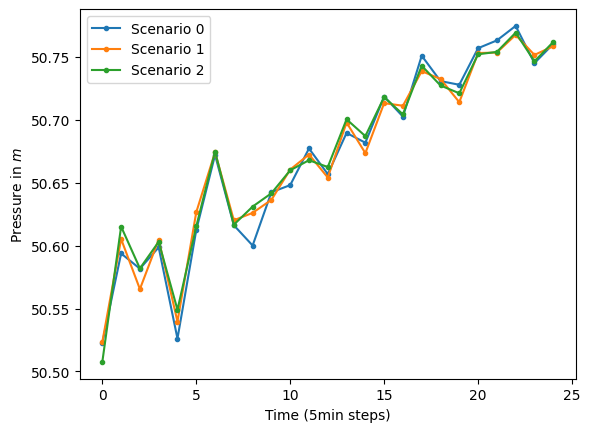
Add uncertainty (i.e. randomness) with respect to the demand pattern – i.e. demand pattern values can deviate up to 25% from their original value. Consequently, the simulation is no longer deterministic and the results vary from run to run.
Here, we use RelativeUniformUncertainty for the demand pattern uncertainty and set it by calling set_model_uncertainty():
[7]:
uc = RelativeUniformUncertainty(low=0.75, high=1.25)

sim.set_model_uncertainty(ModelUncertainty(global_demand_pattern_uncertainty=uc))
Run simulation three times and retrieve sensor readings at node “n105” – do not forget to set reapply_uncertainties=True to get reset the uncertainties before each simulation run:
[8]:
measurements = []
for _ in range(3):
    scada_data = sim.run_simulation(reapply_uncertainties=True)
    measurements.append(scada_data.get_data_pressures(sensor_locations=["n105"]).
                        flatten().tolist())

plot_timeseries_data(np.array(measurements),
                     labels=[f"Scenario {s_id}" for s_id in range(len(measurements))],
                     x_axis_label="Time (5min steps)", y_axis_label="Pressure in $m$")
[8]:
<Axes: xlabel='Time (5min steps)', ylabel='Pressure in $m$'>
Do not forget to close the simulation!
[9]:
sim.close()