Sensor Override Attack Example
[1]:
from IPython.display import display, HTML
display(HTML('<a target="_blank" href="https://colab.research.google.com/github/WaterFutures/EPyT-Flow/blob/main/docs/examples/sensor_override_attack.ipynb"><img src="https://colab.research.google.com/assets/colab-badge.svg" alt="Open In Colab"/></a>'))
This example demonstrastes how to add a sensor overriding attack to a scenario – more information can be found in the documentation.
[2]:
%pip install epyt-flow --quiet
Note: you may need to restart the kernel to use updated packages.
[3]:
import numpy as np
from epyt_flow.data.benchmarks import load_leakdb_scenarios
from epyt_flow.simulation import ScenarioSimulator, SENSOR_TYPE_LINK_FLOW
from epyt_flow.simulation.events import SensorOverrideAttack
from epyt_flow.utils import to_seconds, plot_timeseries_data
Load the first Hanoi scenario in LeakDB:
[4]:
config = load_leakdb_scenarios(scenarios_id=["1"], use_net1=False, verbose=False)[0]
[5]:
sim = ScenarioSimulator(scenario_config=config)
Set simulation duration to two days:
[6]:
sim.set_general_parameters(simulation_duration=to_seconds(days=2))
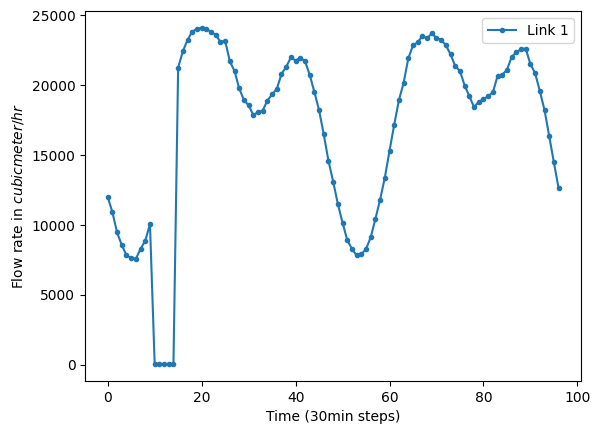
Override the sensor readings of the flow sensor at link “1” with the value “42” for 2hrs – i.e. time steps 10 - 15.
This is done by creating an instance of the SensorOverrideAttack class and adding this sensor reading event to the scenario by calling add_sensor_reading_event():
[7]:
new_sensor_values = np.array([42]*5)
sensor_override_attack = SensorOverrideAttack(new_sensor_values,
                                              start_time=to_seconds(hours=5),
                                              end_time=to_seconds(hours=7),
                                              sensor_id="1",
                                              sensor_type=SENSOR_TYPE_LINK_FLOW)

sim.add_sensor_reading_event(sensor_override_attack)
Run simulation and and plot flow readings:
[8]:
scada_data = sim.run_simulation()
[9]:
scada_data.plot_flows(sensor_locations=["1"])
[9]:
<Axes: xlabel='Time (30min steps)', ylabel='Flow rate in $cubic meter/hr$'>
Sensor readings WITHOUT the sensor overriding attack:
[10]:
# Remove attack
scada_data.sensor_reading_events = []

# Recompute and show final sensor readings
scada_data.plot_flows(sensor_locations=["1"])

[10]:
<Axes: xlabel='Time (30min steps)', ylabel='Flow rate in $cubic meter/hr$'>
Do not forget to close the simulation!
[11]:
sim.close()